
This chapter covers the analysis of technological change, in particular with regard to technological learning, the assessment of learning rates of RES technologies available in literature and forecasting studies and the identification of trade-offs between high energy prices and raw material cost developments. In recent years, energy and raw material prices have shown to have a significant impact on the cost development of RES technologies. Therefore, possibilities for model incorporation to address for these factors have been elaborated.
For many (energy) technologies, a log-linear relation was found between the accumulated experience and the technical (e.g. efficiency) and economic performance (e.g. investment costs). This empirical observed phenomenon can be expressed by formula 4-2 or in logarithmic form rewritten as formula 4-2. The rate at which cost decline for each doubling of cumulative production is expressed by the progress ratio (PR). A progress ratio of 90% results in a learning Rate (LR) (4-4) of 10% and similar cost reduction per doubling of cumulative production (IEA 2000; Junginger, Sark et al. 2010).

The historic development of the investment costs of three RES technologies (on- and offshore wind, PV) and two fossil fuel power systems (natural gas combined cycle and pulverized coal plants) plotted against the cumulative installed capacity on a double logarithmic scale in Figure 5-1 . All technologies included show a log-linear decreasing trend with strong reductions in investment costs. The strongest decline was found for PV, that decreased from several hundred €/Wp in the 1960s to 4-5 €/Wp at present. From 2002 onwards, a discontinuation of the decreasing learning trends was observed for these technologies and costs even started to increase. The drivers that underlie these negative learning trends are, amongst others, increased commodity and energy prices, overheated markets, and shortages of skilled labour and production capacities that leveled out learning effects. These effects and are discussed in detail in the following subsections.
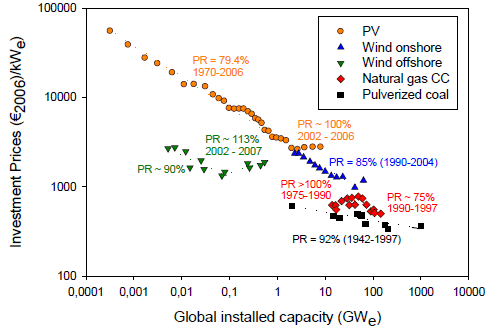
Figure 5-1: Comparison of experience curves for energy conversion technologies, based on historical data (Junginger, Sark et al. 2010)
A state-of-the-art overview of technological learning in the energy sector, including a wide range of renewable energy technologies, was recently published in Junginger et al. (2010). The results of this section are therefore mainly based on the available RES technologies in Junginger et al. (2010). The technologies included in the assessment are: on- and offshore wind, photovoltaics (PV), concentrated solar power (CSP) and energy from biomass (electricity and fuels).
Onshore wind has developed from small scale (10 – 30 kW) units during market introduction in the 1970s to a mature technology with units currently up to 5 MWe. The effect of technological learning on the investment cost and electricity production cost of wind turbines has been studied extensively. Table 5-1 provides an overview of the learning rates of onshore wind turbines published in literature after 2002. A complete overview of studies (15) is provided in Junginger et al. (2010).
The progress ratio found for onshore wind ranges from 81 to 101% depending on the selected parameters such as time frame, production or installation region (e.g. at country level or global) and electricity generation costs or investment costs. As shown in figure 14, the investment cost of onshore wind turbines have more than halved over the last 20 years. After, 2004 however, the investment costs increased again from 980 €/kW in 2004 to 1380 €/kW in 2008. After 2008, the cost stabilized, but may increase again in the coming years (Junginger, Lako et al. 2010). The learning rates applied in Green-X are in range with Extool (Neij et al. 2003). These might be underestimated as they are derived from a selected region. A recent study on global wind development (Nemet 2009) shows a progress ratio of 89% for the period 1981 to 2004, however the progress ratio varies significantly if other time periods are selected (PR = 83 – 97%).
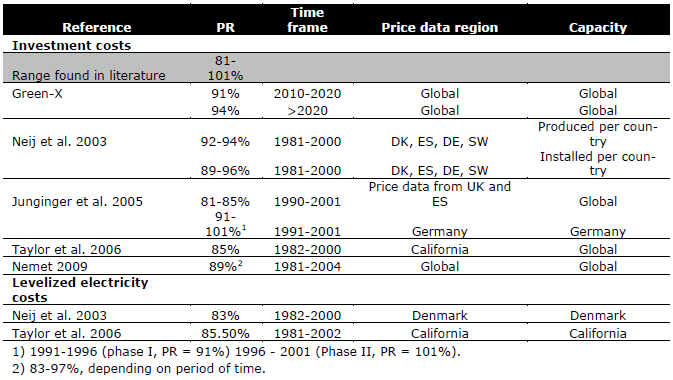
Table 5-1: Overview of progress ratios for onshore wind in Green-X and published in literature (Junginger, Lako et al. 2010)
Offshore wind developed as a near shore derivative from onshore wind turbines to a dedicated technology optimized for offshore conditions. Because the experience with offshore wind turbines is relatively short, empirical trends of cost developments are also limited. According to Lako et al. (2010), the development of offshore wind can be divided into two phases. Phase 1 (1991 -2000) defines the period when offshore wind parks were mainly built to gain experience with the technology. The cumulative capacity in this period did not exceed 100 MWe. In phase 2, after 2001, large parks were started to be built mainly in Europe, but also the US and Asia initiated projects on offshore wind. In 2012, over 10 GWe of cumulative capacity is expected to be installed in Europe alone. Other regions might add another 0.7 GWe (Lako, Junginger et al. 2010).
Three studies are available including experience curves of offshore wind (Table 5-2 ). Lako (2002) differentiates between the turbine section (rotor, nacelle and towers), the offshore construction and the grid connection for offshore wind parks. The study is focused on state-of-the-art systems in the demonstration phase. Junginger et al. (2004) also uses a sub-system approach, but assumes progress ratios of the turbines section analogue to onshore wind turbines. Development of the grid connection costs are based on submarine high voltage direct current (HVDC) cables whereas the foundation costs are based on steel price reductions of 1-2%/yr. Note that these developments have changed over recent years with increasing commodity prices (mainly steel). The installation costs were derived from the installation time of an offshore wind park in Denmark. Isles (2006) found a disconnection between prices and cost of wind turbine manufactures due to lack of competition. The study was based on 22 wind farms of which 19 were in operation built between 1991 and 2006. For the whole time period, Isles found a progress ratio of 97%, but for a two phase experience curve, a progress ratio of 90% was found for 1991 – 2001 and 113% for 2002 – 2007.
The progress ratio for offshore wind in Green-X to 2020 (PR=91) is close to the progress ratio found by Isles (2006) for phase 1 of the development of offshore wind. However, more recent development of the cost of these technologies emphasize the need for incorporating effects other than learning that can have a substantial influence and result negative experience curves (PR=113%) (Figure 5-1). These include, amongst others, the effect of raw material prices, such as steel, on the cost of wind turbines.
Table 5-2: Overview of progress ratios for offshore wind in Green-X and published in literature (Lako, Junginger et al. 2010)

Photovoltaic solar energy (PV) include systems that directly convert (sun)light into electricity of which the most PV systems are based on silicon (95%). Large interest for PV started after the oil crisis in the 1973s when PV was regarded as a potential alternative to fossil fuels. Nevertheless, the cumulative experience of PV cells was still below 100 MWp in the mid 1980s. Rapid growth of PV modules started in 1999 with high annual growth percentages of 30% in 1999 to 87% in 2008 (Sark, Nemet et al. 2010). Due to the efficiency improvements, reduced silicon consumption and reduced cost of silicon, improved crystal growing methods and economies of scale of production facilities (Nemet 2006), the cost of PV per Wp dropped by a factor 20 between 1976 and 2002 (Yu, van Sark et al. 2010). After 2002, the cost of PV modules more or lest stabilized due to increased prices of silicon and silver as observed by Yu et al. (2010) (Figure 5-1 ).
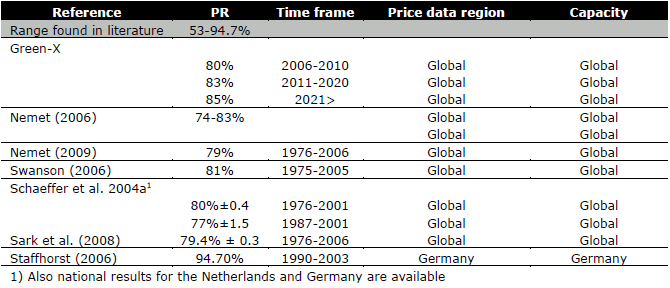
Cost development trends of PV solar energy have been studied extensively resulting in a range of publications. Sark et al. (2010) provide an overview of 20 experience curves published on PV between 1972 and 2009. Table 5-3 depicts the experience curves that were published after 2002 and the progress ratios used in Green-X model. The progress ratios found in these studies ranges from 65% for the EU between 1980 and 1995 (IEA, 2000) to 94.7% for Germany for 1990 to 2003 (Staffhorst, 2006). Sark et al. (2010) conclude that the progress ratio of PV systems can vary substantially with ranges found in literature between 53 and 94.7% depending on the data source and time frame studied.
Table 5-3: Overview of progress ratios for photovoltaics in Green-X and published in literature (Sark, Nemet et al. 2010)
Concentrated Solar Power (CSP) units have been operational since the 1980s with capacities up to 355 MW, but further capacity growth stagnated up to recent years when new units where built in Spain followed by Germany and the US. The cumulative experience of CSP plants is therefore still relatively low compared to other RES technologies such as PV. Nevertheless, some experience curve studies are published on CSP (Sark and Lako 2010). Enermodal (1999) used the SEGS units built in California (SEGS I to SEGS IX) to derive an experience curve (see Table 5-4). For these units, a progress ratio of 88% was found, consistent with Green-X. For future units, Enermodal (1999) estimates that the progress ratio will be between 85 and 92%. For Spanish plants, a progress ratio of 80% was found. Alternatively, DLR (2003) applied a subsystem approach for CSP plants in the ATHENE model with different progress ratios for the collectors, the storage systems and the power generator.
Table 5-4: Overview of progress ratios for concentrated solar thermal enegry in Green-X and published in literature (Sark and Lako 2010)

Although bioenergy is the largest source of renewable energy, experience curve studies on fuels, electricity and heat from biomass are limited. There are several reasons that underlie the complexity to derive experience curves from these systems (Junginger, de Visser et al. 2006; Faaij and Junginger 2010):
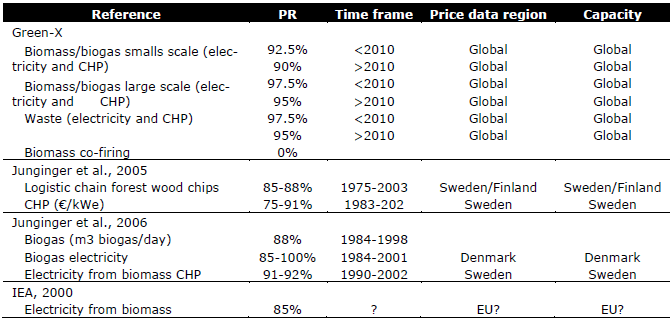
Table 5-5 provides an overview of studies conducted on technological learning in bioelectricity systems. For CHP and biogas, Junginger et al. (2005; Junginger, de Visser et al. 2006) conducted research on experience curves in CHP and biogas plants in Sweden and Finland and Denmark respectively. Furthermore, the IEA presents a progress ratio of 85% for biomass electricity plants for the EU-ATLAS project. It is however unclear if this is based on empirical evidence and if so, what the data source were used.
The assumptions on technological learning for bioelectricity systems in Green-X differ for small scale CHP and electricity (PR=90% after 2010) and large scale electricity, CHP and waste (PR=95% after 2010). For the additional costs of co-firing in coal fired power plants, no learning was assumed in Green-X which is consistent with the expected development of the additional cost of co-firing (IEA 2008).
Table 5-5: Overview of experience curves for biomass electricity in Green-X and published in literature (Faaij and Junginger 2010).
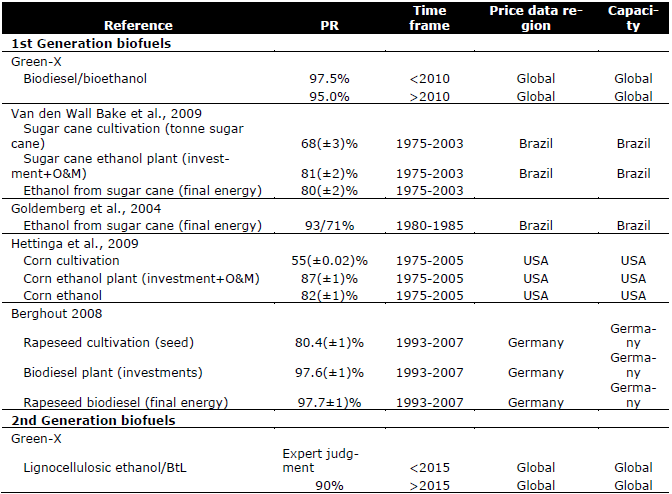
Biofuels include a wide variety of feedstock sources such as sugar and starch crops, oil seeds and lignocellulosic biomass and various conversion systems to create biofuel (ethanol, pure plant oil, fatty acid methyl ester (FAME) or BtL-diesel). Apart from the wide variety of biofuel production system options available, also the cost and performance of these systems are also location and size specific. Crop yields for example depend on climate, soil conditions, and agricultural management. It is therefore infeasible to create general experience curves on biofuels. Nevertheless, Table 5-6 provides an overview on studies conducted on technological learning in biofuel production including sugar cane, corn ethanol and rapeseed-diesel and the assumed progress ratios in Green-X for 1st and 2nd generation biofuels.
For 2nd generation biofuels, there is not sufficient empirical data available to create experience curves due to the limited amount of installations that are deployed up to now. Alternatively, expert judgments are used to project the costs of lignocellulosic ethanol and BtL-diesel up to 2015 when the technology is expected to be commercially available. From 2015 onwards, a progress ratio of 90% is assumed for both biofuel production systems.
For the REFUEL project (2008), de Wit et al. (de Wit, Junginger et al. 2009) developed an alternative approach to address for technological learning of advanced biofuels with a multi-factor learning curve approach. This learning model includes a scale dependent and a scale independent learning factor. The scale dependent factor is bounded by a minimum time before the capacity of a single plant can double (3-5 years) and a maximum market share of a single plant (5%). The scale-independent progress ratio was assumed to be 98-99%.
Table 5-6: Overview of progress ratios for 1st and 2nd generation biofuels in Green-X and published in literature (Faaij and Junginger 2010)
As shown in the previous sections, a number of studies have been published recently, providing new insights on technological learning for renewable energy technologies. Based on this overview, we conclude that the learning rates as employed by Green-X are within the ranges found in (recent) literature. However, it has also become clear that technological learning experience curves sensitive to changes in variables (e.g. time frame, region size), and that especially input prices (i.e. material) prices can have a substantial effect on experience curves, which has previously not been taken into account. Therefore, in the following section, an advanced methodological approach is developed how to include the effect of the main input materials for wind onshore and offshore, photovoltaic solar energy and biomass plants (see page 61, section 4.3 - Impact of key parameter on the mid-term cost development of renewable energy technologies -in the >>D10 Report - Long Term Potentials and Costs of RES<< ).
Another notable aspect is that most learning systems for renewable energy technologies tend to be global, i.e. technological learning takes places with global installed capacity. As Green-X is a European model, and can only endogenously take into account the cumulative capacity used in Europe, this is another factor which may introduce uncertainties in the final results.
In recent years, the prices for renewable energy technologies, such as photovoltaics, onshore and offshore wind turbines and other technologies, have stabilized or even increased in real terms. This was caused by a variety of factors, among them the increasing demand for raw materials (such as steel, concrete, silicon, plastics) and higher production costs due to increased coal, oil and natural gas prices. For an analysis of these impacts we refer to the corresponding project report (Hoefnagels et al., 2011). Also, a strongly increasing demand for renewable power technologies may have caused prices to stabilize, but this effect is not further analyzed in this report.
| <<Back | >>Back to Introduction<< | Next>> |