
The input database of the Green-X model provides a detailed depiction of the achieved and feasible future deployment of the individual RES technologies in Europe – in particular with regard to costs and penetration in terms of installed capacities or actual & potential generation. Realisable future potentials (up to 2020 / 2030) are included by technology and by country. In addition, data describing the technological progress such as learning rates are available. Both serve as crucial input for the model-based assessment of future RES deployment. Thus, this database served as consistent basis for the assessment of mid- and long-term potentials conducted within this project. This version includes the final update as conducted throughout the RE-Shaping project (status: December 2011).
From a historical perspective, the starting point for the assessment of realisable RES potentials in Green-X was geographically the European Union as of 2001 (EU-15), where corresponding data was derived for all Member States (initially in 2001) based on a detailed literature survey and a development of an overall methodology with respect to the assessment of specific resource conditions of several RES options. Next, within the framework of the study “Analysis of the Renewable Energy Sources’ evolution up to 2020 (FORRES 2020)” (see Ragwitz et al., 2005) comprehensive revisions and updates have been undertaken, taking into account reviews of national experts etc. Consolidated outcomes of this process were presented in the European Commission’s Communication “The share of renewable energy” (European Commission, 2004). Within the scope of the EU research project futures-e again an intensive feedback process at the national and regional level was established. A series of six regional workshops was hosted by the futures-e consortium around the EU within 2008. The active involvement of key stakeholders and their direct feedback on data and scenario outcomes helped to reshape, validate and complement the previously assessed information.
Within the model Green-X, supply potentials of all main technologies for RES-E, RES-H and RES-T are described in detail.
The potential supply of energy from each technology is described for each country analysed by means of dynamic cost-resource curves. Dynamic cost curves are characterised by the fact that the costs as well as the potential for electricity generation / demand reduction can change each year. The magnitude of these changes is given endogenously in the model, i.e. the difference in the values compared to the previous year depends on the outcome of this year and the (policy) framework conditions set for the simulation year.
Moreover, the availability of biomass is crucial as this energy is faced with high expectations with regard to its future potentials. The total domestic availability of solid biomass by 2030 was assessed at 245 Mtoe/yr. During the previous update as conducted throughout 2009 biomass data has been cross-checked with DG TREN, EEA and the GEMIS database (1). As biomass may play a role in all sectors, also the allocation of biomass resources is a key issue. Within the Green-X model, the allocation of biomass feedstocks to feasible technologies and sectors is fully internalised into the overall calculation procedure. For each feedstock category, technology options (and their corresponding demands) are ranked based on the feasible revenue streams as applicable for a possible investor under the conditioned scenario-specific energy policy framework, which obviously may change year by year. In other words, the supporting framework may have a significant impact on the resulting biomass allocation and use.
According to the classification of the realisable potential in Figure 2-1 the identified short-term RES potential (2020) is compared in the following part to the assessment on the mid-term potential (2030). The potentials are discussed in relative terms (i) compared to the current (2005) demand and (ii) with respect to the growth rate compared to the 2020 short-term potential.
In France, Sweden and Germany, the contribution of RES to the final energy demand the EU27 is the highest among all Member States. Nevertheless, countries like Denmark, Estonia, Latvia or Sweden provide the most future RES resources up to 2030 expressed as percentage of the total energy demand, see Figure 3-1.

Figure 3-1: Comparison of short-term (2020) and mid-term (2030) realisable potential for RES in terms of (gross) final energy for all EU-27 Member States.
In absolute figures, the total realisable mid-term potential of EU-27 countries up to 2030 is 551 Mtoe – an increase of 203 Mtoe compared to the short-term potential of 2020. RES potentials of 445 Mtoe are distributed among the former EU-15 countries. In the EU-15, France contributes most, with a total potential of 85 Mtoe. Among the new Member States, high RES potentials are identified for Poland (33 Mtoe), Romania (18 Mtoe) and Hungary (9 Mtoe).
A comparison of the mid-term (2030) and short-term (2020) RES potential indicates an increase of realisable resources by 58% at EU level, whereas an unequal distribution of the additional potential is given. The strongest increase of 160% occurs in Luxembourg, followed by Malta (149%), Cyprus (147%), Belgium (113%), Ireland (120%) and the UK (102%).
Next, a closer look on the individual energy sectors is taken. As presented in Figure 3-2 , the heat sector provides the largest exploitable potential up to 2020 (14.2% of the current final energy demand), followed by the electricity sector (11.1% of the current final energy demand). Figure 2-3 also depicts the feasible contribution of RES up to 2030 for RES in the transport, heat and electricity sector, measured in relative terms as share of current (2005) gross final energy demand. Consequently, in 2030, the largest potential is expected to be applicable for RES in the heat sector, rising from 14.2% (2020) to 22.0% (2030). Of similar magnitude is the increase for RES-electricity, while for biofuels in the transport sector growth perspectives are substantially smaller.
The strong increase of RES-E potentials beyond 2020 is mainly caused by the large additional realisable potential of wind energy, especially offshore wind, and the increased availability of novel technology options such as photovoltaics, tidal and wave energy. In the case of photovoltaics, more than a tripling of the realisable short-term (2020) potential is indicated. For tidal and wave energy as well as solar thermal electricity, even higher increases are assumed. However, wind onshore still provides the largest total potential among all RES-E options. In contrast, the potentials for large-scale hydropower and solid biomass remain almost stable beyond 2020. With respect to the heat similar increases in the period 2020 to 2030 are notable, while potentials for biofuels for transport purposes rise to a smaller extent - see Figure 3-2.

Figure 3-2: Sectoral breakdown of short-term (2020) and mid-term (2030) realisable potential for RES in terms of final energy at EU27 level – expressed in relative terms, as share on current (2005) (gross) final energy demand.
Figure 3-3 aims to illustrate to what extent RES may contribute to meet the energy demand within the European Union (EU-27) up to the year 2030 by considering the specific resource conditions and current technical conversion possibilities (2) as well as realisation constraints in the investigated countries. As explained before, realisable mid-term potentials are derived, describing the feasible RES contribution up to 2030. Thus, only the domestic resource base is taken into consideration – except for forestry biomass, where a small proportion of the overall potential refers to imports from abroad. (3) Subsequently, an overview is given on the overall mid-term potentials in terms offinal energy by country, followed by a detailed depiction as done exemplarily for electricity sector.
Summing up all RES options applicable at country level, Figure 3-3 depicts the achieved and additional mid-term potential for RES in all EU member states. Note that potentials are expressed in absolute terms. Consequently, large countries (or more precisely those member states possessing large RES potentials) are getting apparent. For example, France, Germany, Italy, Poland, Spain, Sweden and the UK are comparable. To illustrate the situation in a suitable manner for small countries (or countries with a lack of RES options available), Figure 3-4 offers a similar depiction in relative terms, expressing the realisable mid-term potential as share on final energy demand.

Figure 3-3: Achieved (2005) and additional mid-term (2030) potential for RES in terms of final energy for all EU member states (EU27) – expressed in absolute terms.
The overall mid-term potential for RES in the European Union amounts to 551 Mtoe, corresponding to a share of 45.5% compared to the overall current (2005) gross final energy demand (5). In general, large differences between the individual countries with regard to the achieved and the feasible future potentials for RES are observable. For example, Sweden, Latvia, Finland and Austria represent countries with a high RES share already at present (2005), whilst Bulgaria and Lithuania offer the highest additional potential compared to their current energy demand. However, in absolute terms both are rather small compared to other large countries (or more precisely to countries with significant realisable future potentials).
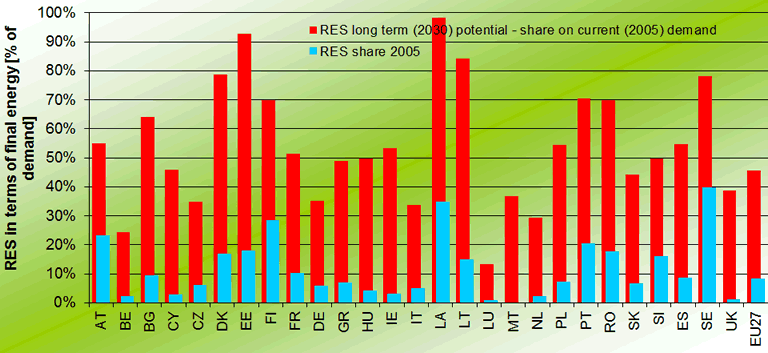
Figure 3-4: Achieved (2005) and total mid-term (2030) potential for RES in terms of final energy for all EU member States (EU27) – expressed in relative terms, as share on (gross) final energy demand.
Below, Figure 3-5 relates derived potentials to the expected future energy demand. More precisely, it depicts the total realisable mid-term potentials on a country level (6) (up to 2030) for RES as share on final energy demand in 2005 and in 2030, considering two different demand projections – a baseline and a high energy efficiency scenario taken from PRIMES modelling (7). The impact of setting accompanying demand side measures to reduce demand growth is becoming apparent: the overall mid-term potential for RES up to 2030 is in size of 45.5% compared to current (2005) gross final energy demand. Even if this would be fully exploited up to 2030, only 43.7% of EU’s overall final energy consumption could be covered, if the demand increases as expected under ‘business as usual’ conditions. In contrast, if a demand stabilisation and later on also a decrease would be achieved as preconditioned in the PRIMES ‘high energy efficiency’ scenario, RES may contribute to meet almost 49.4% of total demand in terms of final energy.
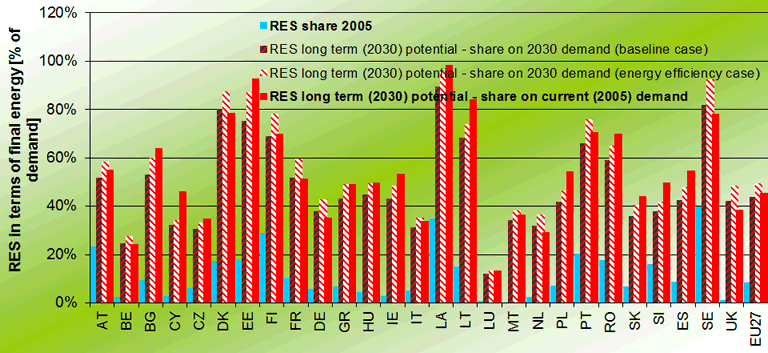
Figure 3-5: The impact of demand growth - Mid-term (2030) potential for RES as share on current (2005) and expected future (2030) (gross) final energy demand.
Finally, a sectoral breakdown of the realisable RES potentials at European level is given in Figure 3-6. The largest contributor to meet future RES targets represents the heat sector. The overall mid-term potential for RES-heat is 21.9% compared to the current (2005) final energy demand, followed by RES in the electricity sector, which may achieve (in case of a full exploitation) a share of 19.5% in total final energy demand. The smallest contribution can be expected from biofuels in the transport sector, which offer (considering solely domestic resources) a potential of 4.1% (on current final energy demand).

Figure 3-6: Sectoral breakdown of the achieved (2005) and additional mid-term (2030) potential for RES in terms of final energy at EU27 level – expressed in relative terms, as share on current (2005) (gross) final energy demand
In the power sector, RES-E options such as hydropower or wind energy represent energy sources characterised by a natural volatility. Therefore, in order to provide an accurate depiction of the future development of RES-E, historical data for RES-E is translated into electricity generation potentials – the achieved potential at the end of 2005 – taking into account the recent development of this rapidly growing market. The historical record was derived in a comprehensive data-collection – based on (Eurostat, 2007; IEA, 2007) and statistical information gained on national level. In addition, future potentials (8) – i.e. the additional realisable mid-term potentials up to 2030 – were assessed (9) taking into account the country-specific situation as well as overall realisation constraints.
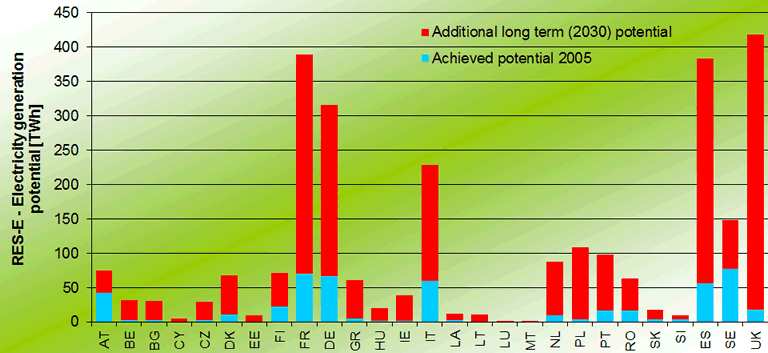
Figure 3-7: Achieved (2005) and additional mid-term potential 2030 for electricity from RES in the EU-27 on country level.
Figure 3-7 depicts the achieved and additional mid-term potential for RES-E in the EU-27 at country level. For EU-27 countries, the already achieved potential for RES-E equals 503 TWh, whereas the additional realisable potential up to 2030 amounts to 2236 TWh (about 67% of current gross electricity consumption). Obviously, large countries such as France, Germany, Spain or UK possess the largest RES-E potentials in absolute terms, where still a huge part is waiting to be exploited. Among the new Member States Poland and Romania offer the largest RES-E potentials in absolute terms.
Consequently, Figure 3-8 relates derived potentials to gross electricity demand. More precisely, it depicts the total realisable mid-term potentials (up to 2030), as well as the achieved potential (2005) for RES-E as share of gross electricity demand in 2005 for all Member States and the EU-27 in total. As applicable from this depiction, significant additional RES potentials are becoming apparent for several countries. In this context especially notable are Denmark, Ireland and the United Kingdom, as well as most of the new Member States. If the indicated realisable mid-term potential for RES-E, covering all RES-E options, would be fully exploited up to 2030, 83% of current gross electricity consumption could be covered. For comparison, by 2005 already installed RES-E plants possess the generation potential to meet about 15% of demand.
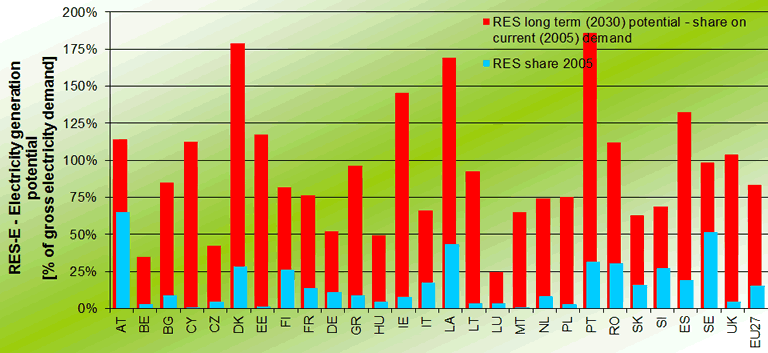
Figure 3-8: Total realisable mid-term potentials (2030) and achieved potential for RES-E in EU-27 countries as share of gross electricity demand (2005).
Additionally, the above-mentioned relations of the total realisable mid-term potential (2030) to the gross electricity demand are addressed in Figure 3-9 with respect to different scenarios on the future development of the electricity demand. A strong impact of the electricity demand development on the share of renewables is noticeable: In a baseline demand scenario (according to PRIMES), a total achievable RES-E share of 66% in the year 2030 would appear feasible, whereas in an efficiency demand scenario, 75% of the electricity demand could be generated by renewables. As already discussed in the previous figure, if the total realisable mid-term potential for RES-E was fully exploited up to 2030, 83% of current gross consumption could be covered, meaning even the efficiency demand scenario takes an increasing electricity demand into account.
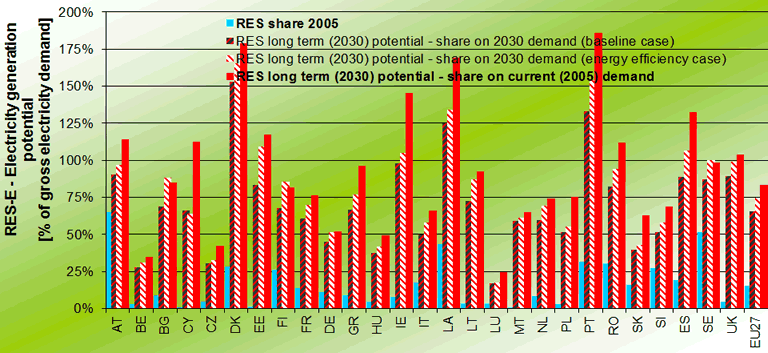
Figure 3-9: Total realisable mid-term potentials (2030) and achieved potential for RES-E in EU-27 countries as share of gross electricity demand (2005 & 2030) in a baseline and an efficiency demand scenario.
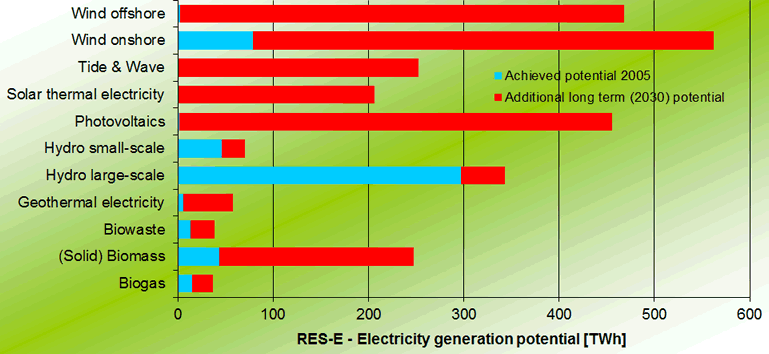
Figure 3-10: Total realisable mid-term potentials (2030) and achieved potential for RES-E in EU-27 countries on technology level.
Figure 3-10 demonstrates both the achieved and the additional realisable mid-term potential up to 2030 on a technology level for the whole EU-27. The figure depicts a high penetration and a small additional realisable potential for hydropower, both small- and large-scale. Wind onshore and solid biomass are both already well developed, but still an enormous additional potential has to be realized to meet future RES-E targets. Moreover, technologies like wind offshore, tide and wave and photovoltaics provide a large additional potential to be exploited up to 2030.
Next, future perspectives are indicated at the country level. As already mentioned, hydropower dominates current RES-E generation in most EU countries, followed by wind, biomass, biogas and biowaste. Figure 3-11 shows the share of different energy sources in the additional RES-E mid-term potential up to 2030 for the EU-15. The largest potential is found for wind energy (43%) followed by photovoltaics (19%) and biomass (10% - as aggregate of solid and gaseous biomass as well as biowaste), as well as promising future options such as tidal & wave (13%) or solar thermal energy (10%).
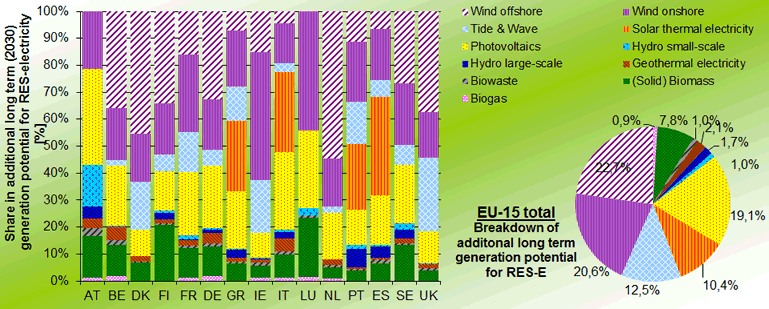
Figure 3-11: RES-E as a share of the additional realisable potential in 2030 for the EU-15 – by country (left) as well as for total EU-15 (right).
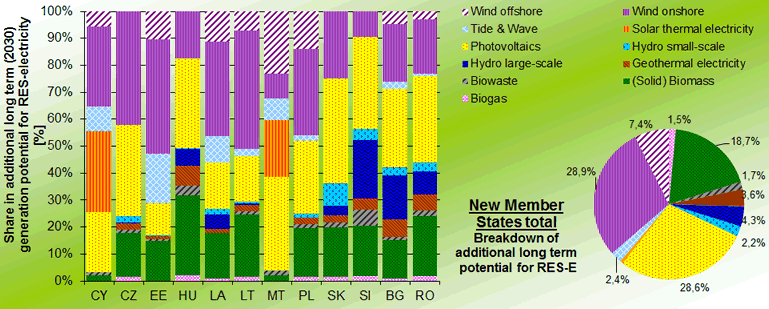
Figure 3-12: RES-E as a share of the additional realisable potential in 2030 for the NMS – by country (left) as well as for total NMS (right).
In the NMS, currently, almost 88% of the renewable electricity is generated by hydro power plants and 10% by solid biomass, mainly co-fired in thermal fossil fuel-based power plants. Only a minor part is provided by novel technologies such as wind energy and biogas. Figure 3-12 provides the 2030 depiction for New Member States (NMS), illustrating the share of different RES-E options in the additional mid-term potential up to 2030. In line with the EU-15, the largest potentials for these countries exist in the sectors of wind energy (36%) and photovoltaics (29%) followed by solid biomass (22%). Unlike the situation in the EU-15, the refurbishment and construction of large hydro plants holds significant potentials (4%).
| <<Back | >>Back to Introduction<< | Next>> |
(1) For example the EEA report "How much bio-energy can Europe produce without harming the environment?" (EEA, 2005) gives 235 Mtoe in 2020 for total biomass under the assumption of significant ecological constraints on biomass use.
(2) The illustrated short-term potentials describe the feasible amount of e.g. electricity generation from combusting biomass feedstock considering current conversion technologies. Future improvements of the conversion efficiencies (as typically considered in model-based prospective analyses) would lead to an increase of the overall short-term potentials.
(3) Approximately 12.5% of the overall forestry potential or 30% of the additional forestry resources that may be tapped in the considered time horizon refer to such imports from abroad, see also section 2.4.
(4) (Gross) Final energy is hereby expressed in line with the definition as given in the proposal of the Renewable Energy Directive as published by the European Commission on the 23 January 2008.
(5) It is worth to mention that biofuel imports from abroad are not considered in this depiction. Assuming imports corresponding to 5% of the current demand for diesel and gasoline (i.e. half of the minimum target of 10% biofuels by 2020) would increase the overall RES potential by 1%.
(6) The total realisable mid-term potential comprises the already achieved (as of 2005) as well as the additional realisable potential up to 2030.
(7) In order to ensure maximum consistency with existing EU scenarios and projections, data on current (2005) and expected future energy demand was taken from PRIMES. The used PRIMES scenarios are:
The European Energy and Transport Trends by 2030 / 2007 / Baseline (NTUA, 2007a)
The European Energy and Transport Trends by 2030 / 2007 / Efficiency Case (17% demand reduction compared to baseline). (NTUA, 2007b)
Please note that this data (and also the depiction of corresponding RES shares in demand) may deviate from actual statistics.
(8) The electricity generation potential with respect to existing plant represents the output potential of all plants installed up to the end of 2005. Of course, figures for actual generation and generation potentials differ in most cases – due to the fact that in contrast to the actual data, potential figures represent, e.g. in case of hydropower, the normal hydrological conditions, and furthermore, not all plants are installed at the beginning of each year.
(9) A brief description of the potential assessment is given e.g. in (Resch et al., 2006).