This subsection is dedicated to look beyond the scope of the 2020 RES Directive, illustrating feasible pathways of RES development at EU level up to 2030. First a comparison of Green-X scenarios conducted in RE-Shaping to other modelling work is presented, assessing the consistency of Green-X and PRIMES scenarios. Next, technology perspectives are discussed, constrained to RES in the electricity, and finally implications for investments and support are discussed.
We start with a comparison of selected Green-X RES policy cases conducted within RE-Shaping and three general energy scenarios calculated with the PRIMES model:

Figure 4-1: RES share in gross final energy demand in the period 2011 to 2030 (left) and by 2030 (right) in the EU-27 according to the selected Green-X and PRIMES scenarios.
Figure 4-1 (above) shows the development of the RES share in gross final energy demand throughout the period 2011 to 2030 (left) in the EU-27 according to the assessed Green-X and PRIMES scenarios, and on the right-hand side of this graph a closer look is taken on the resulting RES deployment by 2030. The corresponding depiction is given in Figure 4-2 for RES in the electricity sector, indicating the RES-E share in gross electricity demand.
It becomes apparent that each Green-X scenario finds its pendant in PRIMES modelling:
Thus, for 2020 both projections differ significantly.
Thus, it can be concluded that a dedication to RES for meeting ambitious climate targets would imply only a continuation of efforts already taken to meet the current (2020) RES commitment.

Figure 4-2: RES-E share in gross electricity demand in the period 2011 to 2030 (left) and by 2030 (right) in the EU-27 according to the selected Green-X and PRIMES scenarios

Figure 4-3: Development of electricity generation from RES by technology in the EU-27 up to 2030 according to the BAU case (left - with barriers prevailing and a high energy demand) and the case of “strengthened national policies” (right - assuming a moderate energy demand (reference case))
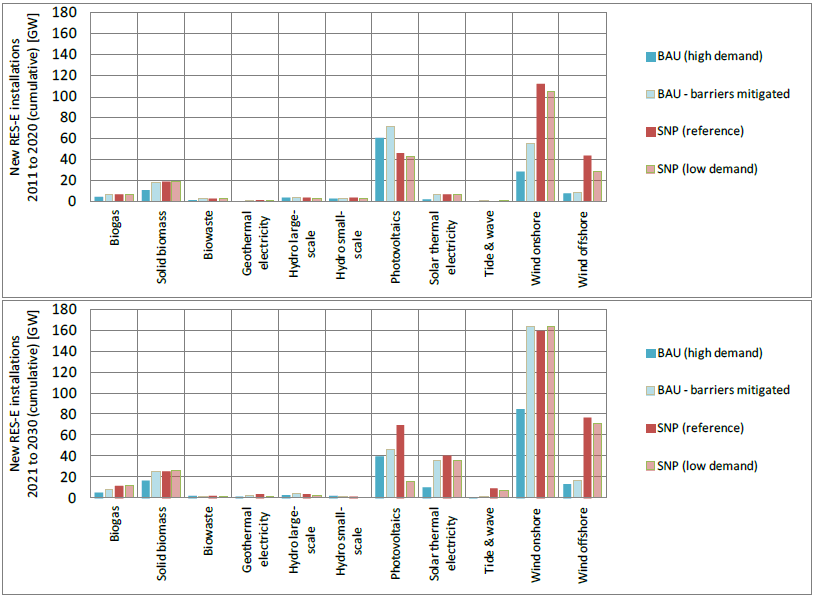
Next a closer on the role of individual RES technologies for power generation is taken according to the assessed Green-X scenarios. In this context, Figure 4-3 provides a graphical illustration of the expected deployment of individual RES-E technologies at EU level up to 2030 according to two distinct scenarios – i.e. a BAU case assuming a high energy demand in forthcoming years, and the default case of “strengthened national RES policies” where demand trends can be classified as moderate. Complementary to this, Figure 4-4 allows for all assessed cases (i.e. both BAU and SNP variants) a comparison of capacity additions for the period before and after 2020, expressing cumulative new RES-E installations by technology within the first (2011 to 2020) and the second decade (2021 to 2030) of the assessment period.
As a general trend, strong differences between BAU and “strengthened national policies” have been observed for the 2020 timeframe and for example from Figure 4-3 it becomes apparent that this will remain in the period beyond 2020. The amount of new RES-E installed within the period 2011 to 2020 doubles in the case of “strengthened national support” compared to BAU (with prevailing barriers), and in the period 2021 to 2030 this deviation rises even further (+125% compared to BAU). The differences in RES-E deployment are caused by both the underlying RES-E policy design (i.e. the basket of technologies included and the financial support offered) and the importance of non-economic barriers, assuming that they remain in place (BAU) or that they are mitigated in the near future (SNP).
Noteworthy, a comparison of new installations before and after 2020 indicates for all assessed policy options a strong increase in later years, ranging from +45% (BAU) to 71% (BAU with barriers mitigated).
Wind onshore represents the key (RES) technology option for power generation before and after 2020. Differences between the assessed policy cases are however apparent, whereby the impact of non-economic barriers appears to play a key role, in particular in the long-term, compare e.g. the BAU variants w/o mitigation of non-economic deficits. Other key technologies are photovoltaics, wind offshore, solid biomass, biogas and solar thermal electricity. As a general trend, deployment increases beyond 2020 for RES-E technologies within all policy cases. For biogas and solar thermal electricity this increase is however more pronounced, in particular if non-economic barriers are removed. Other RES-E options like hydropower (large- and small-scale), biowaste or geothermal electricity appear less significant with respect to capacity additions, but their deployment can generally be classified as stable (i.e. only marginally influenced by the assessed RES policy framework).

Figure 4-4: Comparison of capacity additions in the period 2011 to 2020 (top) and in the period 2021 to 2030 (bottom) in the EU-27 according to selected BAU cases and variants of “strengthened national policies”
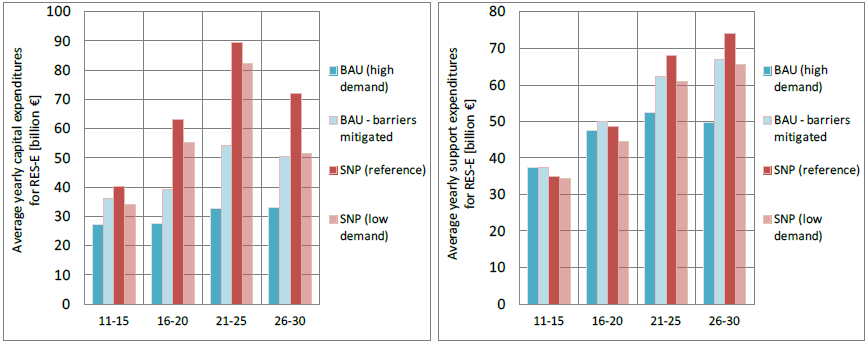
Figure 4-5 shows the development of capital and support expenditures up to 2030 in the EU-27 according to all assessed cases, i.e. the BAU cases w/o mitigation of barriers and the two variants of “strengthened national policies” that differ by underlying demand trends. It is apparent that an enhanced deployment of RES-E has implications on cost, benefits and expenditures. Thus, in the default BAU case (with prevailing non-economic barriers) capital expenditures stay at a comparatively constant level, ranging from 27 to 33 billion €. Investment needs rise if deployment increases. Consequently, the upper boundary of capital expenditures is given by the (default) case of “strengthened national policies” where compared to BAU a strong increase is apparent not only on average, but also over time. A peak level of 89 billion € occurs in the period 2021 to 2025, and on average investments increase by +117% compared to BAU.
For support expenditures differences between the policy variants are generally less pronounced, in particular in the early years up to 2020. Later on, beyond 2020, differences are observable but the magnitude is much smaller than in deployment or in capital expenditures. This confirms that a strengthening of RES support has a positive impact on deployment but the resulting support expenditures do not necessarily increase much.

Figure 4-5: Development of (5 year) average yearly capital (left) and support expenditures (right) up to 2030 in the EU-27 according to selected BAU cases and variants of “strengthened national policies”
| <<Back | >>Back to Introduction<< |
(11) Please note that this Green-X BAU case assumes similar energy demand and price trends as the PRIMES reference case.
(12) Note that the Green-X SNP variant assuming a “low energy demand” builds on the PRIMES high renewable case with respect to energy demand and price trends. On the contrary, the default Green-X SNP case assumes a higher energy demand in forthcoming years, i.e. identical to the PRIMES reference case as discussed above.