2 20% RES by 2020 – strengthening of national RES support
With currently implemented RES support – i.e. according to our scenario definition named as “business-as-usual” (BAU) case – it can be expected that the majority of EU countries would fail to trigger the required investments in new RES technologies as needed for 2020 RES target fulfilment. Subsequently we present the impact of individual measures to move from BAU to a policy path where all Member States would meet their RES commitments. More precisely, the BAU scenario, implying that all relevant energy policies and energy market structures will remain unchanged, is compared to a scenario of “strengthened national policies” (SNP), considering improved financial support as well as the mitigation of non-economic barriers that hinder an enhanced RES deployment. (1)

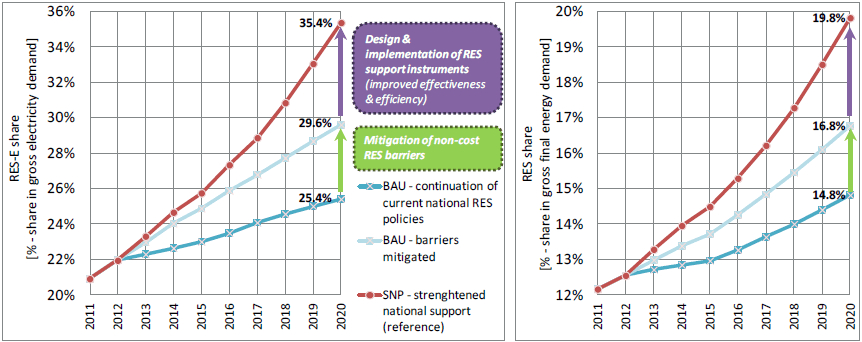
Figure 2-1: RES-E (left) and RES (right) deployment (expressed as share in gross electricity demand (left) / gross final energy demand (right)) in the period 2011 to 2020 in the EU-27 according to the BAU case (incl. a sensitivity variant of mitigated barriers) and the (default) case of “strengthened national policies”

Figure 2-2: Yearly support expenditures for RES-E (left) and for RES (right) in the period 2011 to 2020 in the EU-27 according to the BAU case (incl. a sensitivity variant of mitigated barriers) and the (default) case of “strengthened national policies”
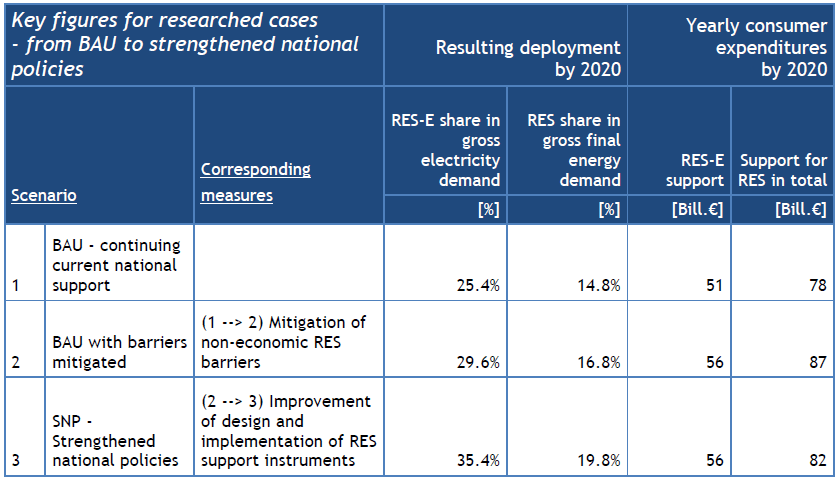
Figure 2-1 shows the future deployment in relative terms for both RES-E (left) and RES in total (right) in the EU-27 in the period 2011 to 2020 for the BAU case (incl. a sensitivity variant of mitigated non-economics barriers) and the case of “strengthened national policies”. More precisely, this graph illustrates the RES-E share in gross electricity demand (left) and the share of RES (in total) in gross final energy demand (right). Complementary to this, Figure 2-2 depicts the corresponding development of yearly RES support expenditures for the identical scenario selection. Similar to above, results are presented for both RES-E (left) and RES in total (right) in the EU-27 for the forthcoming years up to 2020. Finally, Table 2-1 provides a concise depiction of key figures with respect to RES(-E) deployment by 2020 and corresponding support expenditures for the researched cases, indicating also the individual measures to move from BAU to strengthened national RES policies.
Table 2-1: Key figures on RES(-E) deployment by 2020 and corresponding support expenditures for researched cases (from BAU to strengthened national policies)

An accelerated development of RES-E as well as RES in total can be expected with effective and efficient RES support in place (as assumed for the case of “strengthened national policies”) while under BAU conditions a rather constant but moderate deployment is projected for the period up to 2020. Analysing the above illustrated sensitivity variants of the BAU case and the “strengthened national policies” scenario indicates the impact of the individual key measures to move from a BAU to an enhanced RES deployment in line with 20% RES by 2020:
Retaining current financial RES support but supplemented by a mitigation of non-economic deficits would allow for a 2020 RES-E share of 29.6% (compared to 25.4% as default). The corresponding figure for RES in total is 16.8% (instead of 14.8% as default). A significant impact can be also observed for the corresponding yearly support expenditures due to RES(-E) support. Required expenditures by 2020 would increase by a similar magnitude under the assumed retaining of current support conditions (without any further adaptation) – i.e. rising from about 51 to € 56 billion in 2020 for RES-E solely, while expenditures for RES in total increase from 78 to € 87 billion. This indicates the need to align support conditions to the expected / observed market development, as otherwise specifically novel RES technologies would achieve significant oversupport in case of future mass deployment;
The detailed policy design has a strong impact on the RES deployment and corresponding expenditures. This is apparent from the comparison of the “strengthened national policy” case with the BAU variant where similar framework conditions are conditioned (i.e. mitigated (non-economic) barriers and a moderate demand development). For RES-E the direct improvement of the efficiency and effectiveness of the underlying support instruments leads to an increase of the RES-E share from 29.6% (BAU with removed barriers) to 35.4% (“strengthened national policies”). For RES in total, the impact on deployment is of similar magnitude – i.e. an increase of the RES share of gross final energy demand from 16.8% to 19.8% is observable. With respect to support expenditures, the impact of improving RES policy design is pronounced for the electricity sector – while the cost burden stays at the same level, deployment increases significantly. More precisely, yearly expenditures for RES-E in 2020 remain at € 56 billion and the corresponding deployment is expected to increase from 29.6 to 35.4%. For RES in total a decline in support expenditures is apparent (i.e. from € 87 billion to € 82 billion) while RES deployment increases from 16.8 to 19.8%, meaning a fulfilment of national 2020 RES targets in all EU Member States.
Thereby, complementary to strengthening financial support, the mitigation of non-economic barriers is of key relevance. As stated above, if currently implemented national RES support instruments are retained without further adaptation, the EU would fail to deliver as required for meeting its 2020 RES commitment. But how do individual Member States perform? Is improving financial support conditions of key relevance or shall more emphasis be put on the surrounding framework conditions, that is the mitigation of currently prevailing non-economic constraints?
Subsequently we offer first insights on the country-specific situations, indicating the expected country-specific RES deployment by 2020 under the researched scenarios of different national RES policy options is envisaged subsequently. Figure 2-3 ranks Member States according to the gap (or surplus) to their binding 2020 RES target if currently implemented RES policies will remain in place (2) (3). Additionally, this graph indicates also gaps or surpluses to RES targets for the BAU case with mitigated non-economic barriers and the default case of “strengthened national policies”.

Figure 2-3: RES deployment versus targets: Comparison of the country-specific domestic (incl. biofuel trade) RES deployment in 2020 according to the BAU case (incl. a sensitivity variant of mitigated barriers) and the (default) case of “strengthened national policies”
As applicable from Figure 2-3 , the majority of Member States will fail to deliver the required RES deployment in 2020 if no further measures or adaptations are taken. Only four out of 27 countries – that is Sweden, Austria, Finland and Estonia – may succeed in (over)fulfilling their 2020 RES targets with RES policies in place under the current framework conditions. In contrast to above, a long list of countries may end up with a significant gap to their 2020 RES target (4). On average at EU level, a gap of 5.2% (of gross final energy demand) occurs in the BAU case. The picture improves if non-economic barriers are mitigated, and at EU level the gap decreases to 3.2%. On the one hand, this leads to a significant improvement in the majority of Member States. On the other hand, in a few countries – that is the Netherlands, Malta, Belgium, Luxembourg, Hungary and Portugal – changes arising from the removal of non-economic barriers are less pronounced which underpins the need to strengthen the financial support offered. Complementary to above, the results referring to the case of “strengthened national RES policies” show that cooperation is a key necessity for several Member States, at least if Member States aim for an effective and from an economic viewpoint efficient RES target fulfilment. For further insights on the need for and impact of RES cooperation we refer to the corresponding scenario report (see Resch et al. (2012)) or section 2.2 of this report.
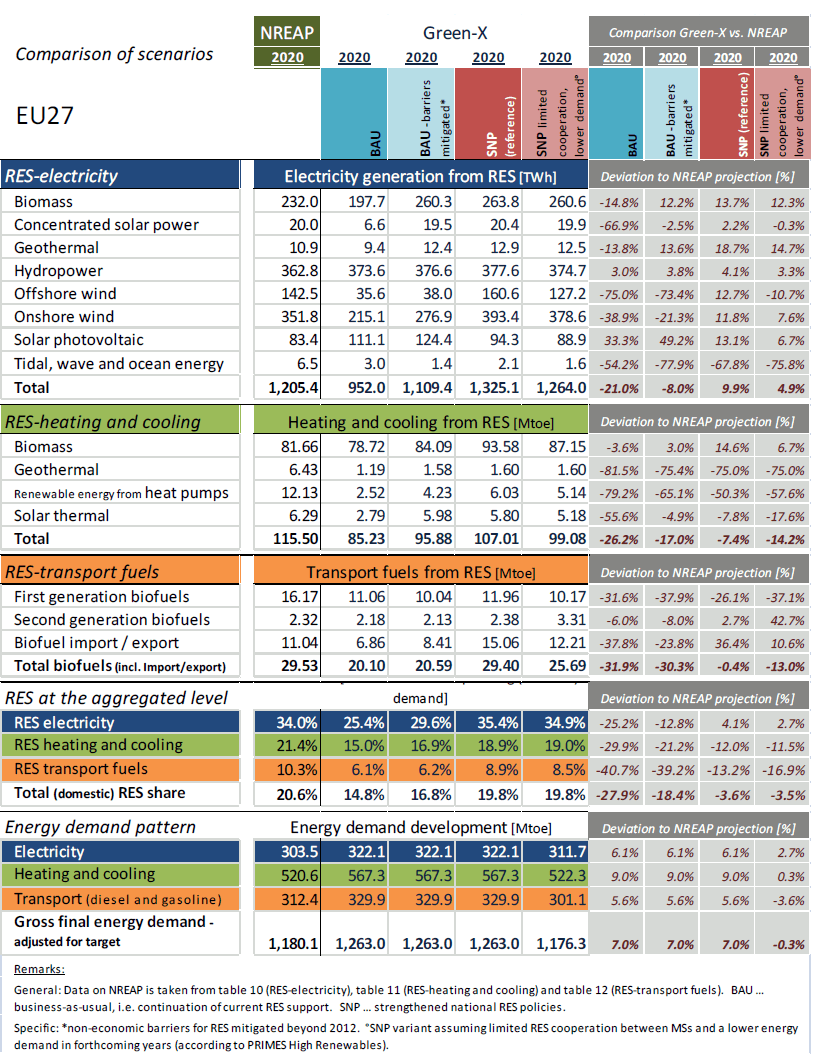
This section compares the scenarios computed within the Re-Shaping project with projections in the NREAPs, submitted by EU Member States in 2010. When comparing these projections it has to be taken into account that cumulatively at EU level the NREAPs assume a slightly lower overall energy demand for 2020 than in the PRIMES reference case (NTUA, 2011) used as default reference for energy demand and price assumptions within this modelling exam. Therefore the most relevant reference case in terms of technology choices is the variant of “strengthened national policies” (SNP) where a lower demand is conditioned and, in addition, also only limited cooperation. Since Member States have generally indicated less need for cooperation, this mostly reflects the framework conditions of the NREAPs. In the following the key results will be briefly compared along Table 2-2 and Figure 2-4.
Regarding the overall distribution of RES generation / usage across sectors differences between NREAPs and Green-X scenarios are highest for BAU pathways, which simply illustrates that with the current policy framework in place not enough RES deployment for target fulfilment will be achieved. However for the comparison with SNP pathways differences become rather low, which indicates that the fulfilment of the 20% target requires action across all sectors. Overall Green-X scenarios put a higher weight on the electricity sector compared to the NREAPs. A possible explanation for this might be that policy frameworks designed are more balanced rather than seeking to exploit the least-cost potentials and in a model based scenario world the effect of mitigated barriers and technology dynamics in the electricity sector become more evident.
With regards to technology choices within the sectors the following overall conclusions can be drawn: In the electricity and heating and cooling sector RES technologies with rather niche status play a higher role in the NREAP projections (tidal, wave and ocean energy, geothermal heat, heat pumps), while for the transport sector Green-X foresees a quicker transition toward second generation biofuels, albeit at rather small level. With regards to key technology options like biomass, wind power and solar PV, NREAPs and Green-X scenarios match well. It is noteworthy that solar PV as only technology option gains less deployment when moving from a BAU to a SNP world. However solar PV will remain a key technology option especially in the longer term (beyond 2020) and the scenarios emphasize that in general PV should be deployed more balanced across Europe (i.e. accounting for the large share planned by Germany, additional efforts are still required in several Member States as suggested by the SNP scenarios).
Table 2-2: Comparison of RES deployment in 2020 according to the NREAPs and selected Green-X scenarios (i.e. according to the BAU case (incl. a sensitivity variant of mitigated barriers) and the variants of “strengthened national policies”)

Zooming in from the European perspective Figure 2-4 gives a more detailed comparison on RES deployment across Member States and sectors. With regards to sectoral deployment at country level no general trend can be observed. Larger differences for the projections are only apparent for smaller Member States. Also summing up across sectors differences between NREAP projections and Green-X scenarios remain at country level. Explanations for those differences are, on the one hand, that NREAPs do not always aim to meet exactly the 2020 target – i.e. at EU level a RES share of 20.6% occurs, while in Green-X the assumption was taken that RES targets are not over-fulfilled. On the other hand, except for the case of Italy hardly usage of the cooperation mechanisms is foreseen in the NREAPs (that is Member States seek domestic target fulfilment) whereas the Green-X scenario used for comparison at least assumes a limited use of the cooperation potential.

Figure 2-4: Comparison of RES deployment in 2020 according to the NREAPs and the case of “strengthened national policies” (with limited cooperation and low energy demand)
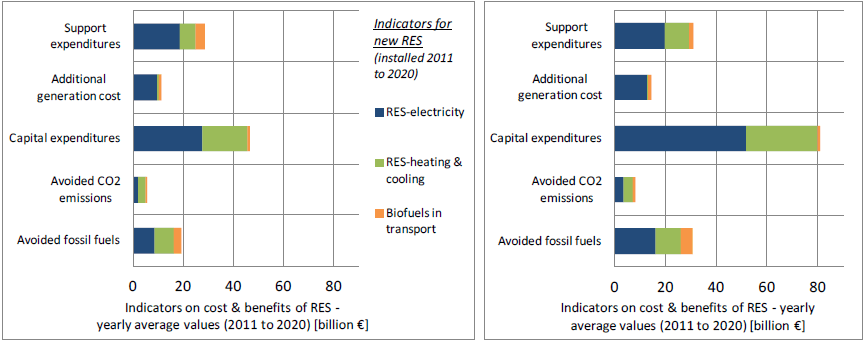
An accelerated RES deployment in the European Union does have a price, but this is also accompanied by increased benefits. Figure 2-5 above provides a concise summary of the assessed costs and benefits arising from the future RES deployment in the forthcoming years up to 2020. More precisely, this graph illustrates for both main cases – i.e. BAU (left) and “strengthened national policies” (right) – the on average per year throughout the period 2011 to 2020 resulting costs – i.e. capital expenditures, additional generation cost, and support expenditures – as well as an indication of the accompanying benefits in terms of supply security (avoided fossil fuels expressed in monetary terms – with impact on a country’s trade balance) and climate protection (avoided CO2 emissions – monetary expressed as avoided expenses for emission allowances). Other benefits – even of possibly significant magnitude - such as job creation or industrial development were neglected in this assessment. (5)
Comparing both cases significant differences can be observed with respect to the required capital expenditures (46 (BAU) versus € 81 billion (strengthened policies)) as well as with regard to the avoidance of fossil fuels (19 (BAU) vs. € 31 billion (strengthened policies)). Other costs (i.e. additional generation costs, support expenditures) or benefits (i.e. avoided CO2 emissions) show less deviation or are of lower magnitude.

Figure 2-5: Overview on costs and benefits (on average (2011 to 2020) per year) with regard to new RES (installed 2011 to 2020) in the EU-27 according to the BAU scenario (left) and the (default) case of “strengthened national policies” (right)
Summing up, remarkable contributions of an accelerated RES deployment to both the EU’s supply security and the combat of climate change are becoming apparent. This is accompanied by (insignificantly) higher support expenditures and a doubling of investment needs.
| <<Back | >>Back to Introduction<< | Next>> |
(1) Note that all changes in RES policy support and non-economic barriers are assumed to become effective immediately (i.e. by 2013).
(2) Note that only RES policies as implemented until January 2011 (as reported in the RE-shaping RES policy country profiles as of March 2011, see Rathmann et al. (2011) are taken into consideration. Planned measures as described in the NREAPs are consequently ignored if not yet implemented by then.
(3) The deviation of the expected domestic RES deployment to the required one (for meeting the 2020 RES target) is generally shown in percentage terms (i.e. as share in 2020 gross final energy demand). Since only domestic RES deployment is counted, any planned (virtual) RES imports or exports through the use of cooperation mechanisms are consequently ignored, while trade impacts for biofuels are considered (where physical trade is already a common practice in almost all Member States).
(4) Latvia, Netherlands, Slovenia, France, UK, Greece, Ireland, Lithuania and Malta are those countries with a gap higher than 6% (of gross final energy demand) under BAU conditions.
(5) For a comprehensive macroeconomic assessment (incl. employment and economic growth impacts) of an accelerated RES deployment we refer to the forthcoming comprehensive assessment as conducted in the EC study EMPLOYRES led by Fraunhofer ISI, see Ragwitz et al. (2009).